Understanding the Concepts of Gantt Chart and Critical Path Methodology (CPM)

Gantt charts:
- Gantt chart is a type of bar chartthat illustrates a project schedule, named after its inventor, Henry Gantt
- A Gantt chart is a project management tool that assists in planning and scheduling projects of all sizes, although they are beneficial for simplifying complex projects.
- This chart lists the tasks to be performed on the vertical axis and time intervals on the horizontal axis. The width of the horizontal bars in the graph shows the duration of each activity.
- This chart is constructed to aid in scheduling the activities (tasks) needed to complete a project
- The charts show when an activity should begin and when it should end along a timeline.
- Gantt charts can also reflect the resources assigned to each task and by what percent allocation.
- Gantt charts can also be used to track the achievement of milestones or significant accomplishments for the project, such as the end of a project phase or completion of a key deliverable.
- Progress of the entire project can be read from the Gantt chart to determine whether the project is behind, ahead, or on schedule compared to the baseline project plan
- The advantage of using a Gantt chart is that it helps you monitor your project’s progress and set priorities.
- The disadvantage of the Gantt chart is that it does not show the dependency of tasks to each other, and it does not show which tasks are ‘critical’ to finishing the project on time.
- Gantt Chart is a reliable technique for estimating the scope and cost of a software development project
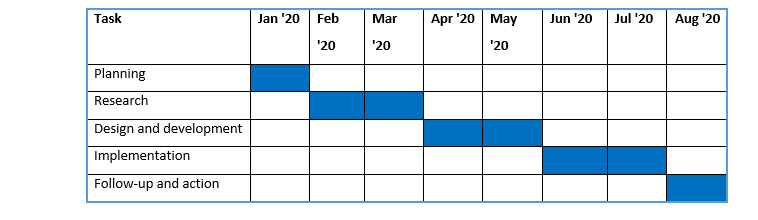
- Here is an example of a Gantt chart:
Critical Path Methodology (CPM):
- The critical path is the sequence of activities whose sum of activity time is longer than that for any other path through the network
- Critical Path Analysis is commonly used with all forms of projects, including construction, aerospace and defense, software development, research projects, product development, engineering, and plant maintenance.
- Any project with interdependent activities can apply this method of mathematical analysis.
- All project schedules have (at least) one critical path, usually only one in non-manipulated project schedules.
- The critical path is important because if everything goes according to the schedule, their duration gives the shortest possible completion time for the overall project
- Activities that are not in the critical path have slack time
- Slack time – It is defined as the amount of time a task can be delayed without causing another task to be delayed or impacting the completion date of the overall project.
- Activities on a critical path have zero slack time, and conversely, activities with zero slack time are on a critical path
- When planning to add personnel to tasks imposing time constraints on the duration of a project, the project’s critical path should be revalidated first.
- Here is a simple example of Critical path methodology:
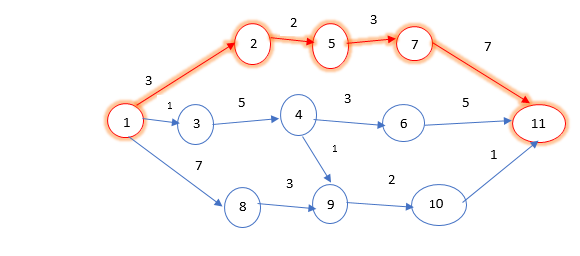
The above picture represents a project. Let us say Project A. The stages of the project range from Stage 1 to Stage 11. There are different ways to complete the project, i.e., to reach stage 11. The numbers mentioned above the arrow marks represent the time taken to complete each task. Now, let’s calculate the time taken to complete the project’s task and the different ways to complete the project.
Path 1 = Stage 1 – 2 – 5 – 7 – Stage 11 = 3 + 2 + 3 + 7 = 15
Path 2 = Stage 1 – 3 – 4 – 6 – Stage 11 = 1 + 5 + 3 + 5 = 14
Path 3 = Stage 1 – 8 – 9 – 10 – Stage 11 = 7 + 3 + 2 + 1 = 13
Path 4 = Stage 1 – 3 – 4 – 9 – 10 – Stage 11 = 1 + 5 + 1 + 2 + 1 = 10
Now, the critical path is the longest route in completing the project. In such a case, in the above picture, path 1 is the longest route, which takes the maximum time to complete the project.
Comparison of Gantt chart and Critical Path methodology:
- Gantt charts do not show how activities relate to one another, but Critical Path methodology shows how each activity is related to one another
- Gantt chart is in the form of a bar chart that lays out project activities and timelines for each activity. The critical path method represents a network diagram that displays each project activity and connects them to show task dependencies
The CPM and Gantt chart are essential concepts for the CISA exam. The CISA certification is a globally recognized certification developed to validate candidates’ skills to manage, monitor, and protect the organization’s IT business environment. The CISA certification training course aims to provide candidates with hands-on knowledge to detect vulnerabilities, report compliance issues, and deploy IT security control.
Check out the latest schedule of Infosec Train’s online CISA certification training course


Contact Us


 1800-843-7890 (India)