Analyzing HTTP communication with Wireshark
Imagine catching a cyber threat just by observing web traffic. Attackers often conceal malicious activity in plain sight over HTTP, knowing that web traffic is ubiquitous and generally trusted. In fact, a recent threat report found that HTTP and HTTPS are the favored channels for over two-thirds of malware samples, which are heavily used for command-and-control and data theft. HTTP is a plaintext protocol, when not encrypted, exposing credentials, site addresses, and other sensitive details to anyone listening. While most of the web has moved to HTTPS, many attacks still leverage HTTP (or misconfigured HTTPS) to fly under the radar.

Step-by-Step Guide to HTTP Traffic Analysis with Wireshark
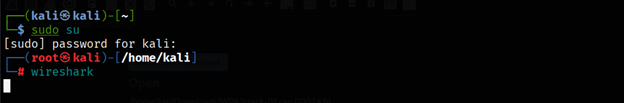
1. Launch Wireshark
Open your terminal and run: wireshark &
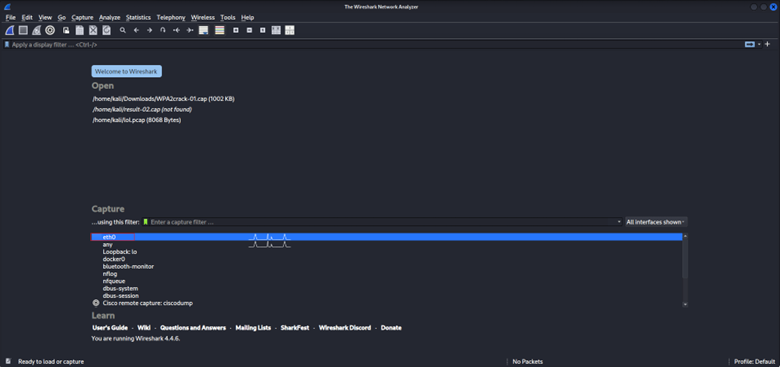
2. Choose the Correct Network Interface
- Select the interface actively handling internet traffic (e.g., eth0, wlan0).
- Look for one with visible packet activity.
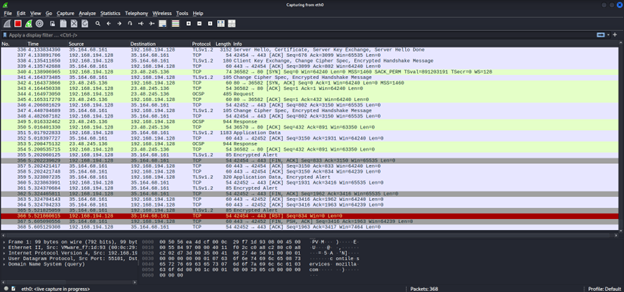
3. Capture the Traffic
Start Wireshark and capture the relevant network interface (or open a saved PCAP file). Let it run during the period of suspect activity so you gather the HTTP packets in question.
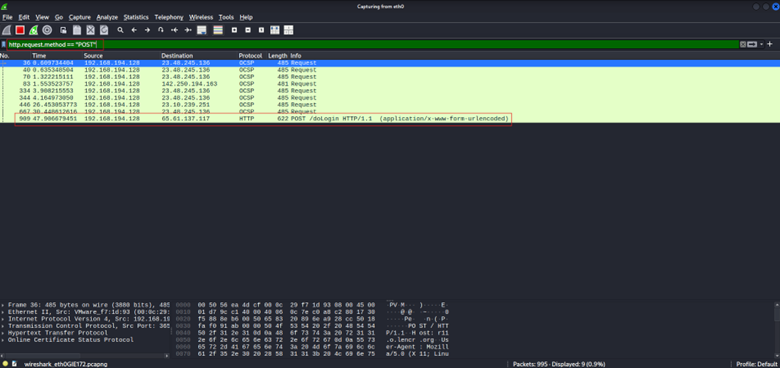
4. Filter for HTTP Traffic
With many packets captured, filtering is your best friend. In the filter bar, type http and hit Enter to display only HTTP packets. Instantly, you will be looking at just web traffic. You can refine further with expressions like http.request.method == “POST” to see only POST requests.
(Note: the http filter hides TCP handshake packets like SYN/ACK, but those are not usually needed for content analysis.)
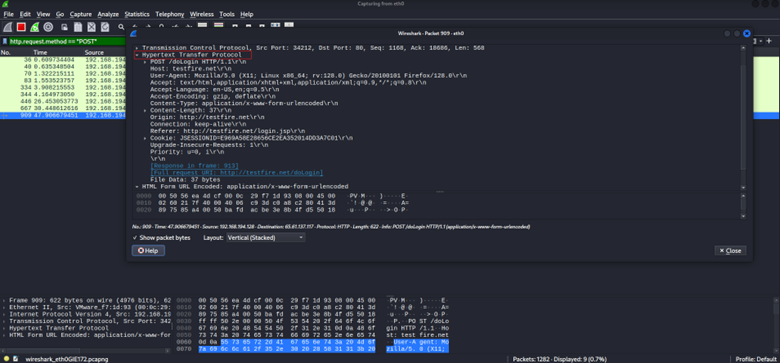
5. Inspect HTTP Requests and Responses
Click on an HTTP packet and expand the Hypertext Transfer Protocol details. For a request, you will see the method (GET, POST, etc.), the URL or path, and headers such as Host (server address) and User-Agent (client identity). For a response, you will see the status code (200, 404, etc.), server information, and possibly the content type or length. Scan these details for anything unusual, such as an odd URL, suspicious parameters, or a weird User-Agent value, as these can all be clues.
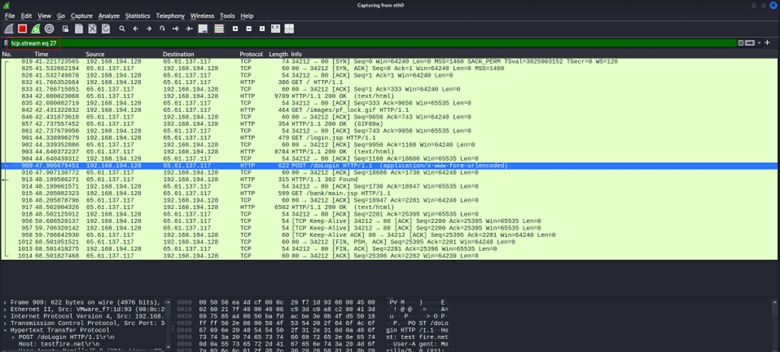
6. Follow the HTTP Conversation
Instead of examining packets one by one, view the whole exchange. Use Wireshark’s “Follow TCP Stream” (right-click a packet > Follow > TCP Stream) to reconstruct the full data exchange over TCP. This shows the full request followed by the full response, making it easy to read the dialogue. If a file or data was transferred, you can save it via File > Export Objects > HTTP – handy for extracting any downloaded malware or documents for analysis.
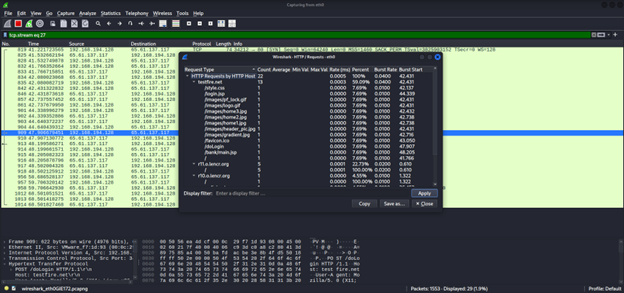
7. Leverage HTTP Statistics
Wireshark’s built-in HTTP analysis tools give you a quick overview of the web traffic. Under Statistics > HTTP, you will find views like Packet Counter, Requests, Load Distribution, and Request Sequence. The Packet Counter tallies HTTP methods and response codes, Requests lists all hostnames and URIs observed, Load Distribution shows the traffic share across servers, and Request Sequence outlines the chains of linked requests.
Investigating Suspicious HTTP Connections
Not all web traffic is innocent. Attackers often craft HTTP requests that appear normal but carry hints of malicious intent. As a threat hunter, watch for:
- Odd URLs or Parameters: HTTP requests with strange URL paths or unusual query strings. Long, random-looking URLs or parameters containing SQL commands or <script> tags are big red flags. Anything that doesn’t fit your application’s normal URL pattern warrants a closer look.
- Strange User-Agent Strings: Malware or scripts often use fake or uncommon User-Agent headers. If you spot a User-Agent like an outdated browser, a generic client (curl, python-requests, etc.), or anything that simply doesn’t match typical user traffic, it could indicate automated or malicious activity. Filter for http.request packets and scan their User-Agent values to find odd ones quickly.
- Known Bad Hosts: Check the Host header or server IP against threat intel. If HTTP requests are going to a domain or IP known for phishing or malware or one that’s completely outside your business’s normal web usage, that is an immediate red flag. Use Wireshark’s filters to isolate traffic to that host and view the data being requested or sent.
Identifying Malware Communication via HTTP
Modern malware often “phones home” over HTTP/HTTPS because it blends into regular web traffic. As a SOC Analyst, pinpointing malicious HTTP conversations is critical. Look for:
- Beaconing Patterns: Malware frequently sends HTTP requests at regular intervals to its command-and-control (C2) server. If you notice an internal machine making HTTP requests to the same external host at steady intervals (e.g., every minute on the dot), you may have found beaconing activity.
- Suspicious Hostnames or IPs: If a device in your network is reaching out via HTTP to an IP or domain that no other system contacts, consider it suspicious. Malware often communicates with a single external server that is outside normal operations. Use Wireshark’s conversation or endpoint statistics to identify which hosts a machine talks to most; an unknown host that only one computer contacts could be a Command and Control (C2) server.
- Encoded or Odd Payloads: Malicious HTTP traffic might carry data in unusual ways. For example, a malware HTTP request could include a long, gibberish string in a URL parameter or header. If you see what looks like random base64 text or binary data inside an HTTP message, it likely indicates a hidden payload or stolen data being smuggled out. Such anomalies in HTTP content are strong indicators of C2 or exfiltration activity.
Advanced Cyber Threat Hunting and DFIR Training with InfosecTrain
Adversaries love to hide in plain sight, and HTTP is often their cloak of choice. But with the right skills and the right tools like Wireshark, you can peel back that cloak and expose what was meant to stay hidden. It is not just about packets; it is about patterns, anomalies, and knowing where to look.
This is exactly what InfosecTrain’s Advanced Cyber Threat Hunting and DFIR, and SOC Analyst Hands-on Training empowers you to do. From mastering tools like Wireshark and Sysmon to dissecting full attack chains and uncovering persistence mechanisms, this training turns Analysts into adversary hunters.
Ready to Level Up Your Threat Hunting Game?
Do not just collect packets. Decode the story they tell.
Join our Advanced Threat Hunting and DFIR Training, where you will go beyond theory and hunt like the pros, with 25+ labs, real-world use cases, and capstone scenarios that mirror enterprise-scale breaches.